How Data Visualization Is Driving Results in a Challenged Apparel Industry

Summary: Data visualization is used to solve the fashion industry's most complex problems. It helps understand the latest market trends and fashion preferences of customers by converting business analytics into sensory values that help businesses gain insights about what customers buy, what style they like, and what the look will be in this season.
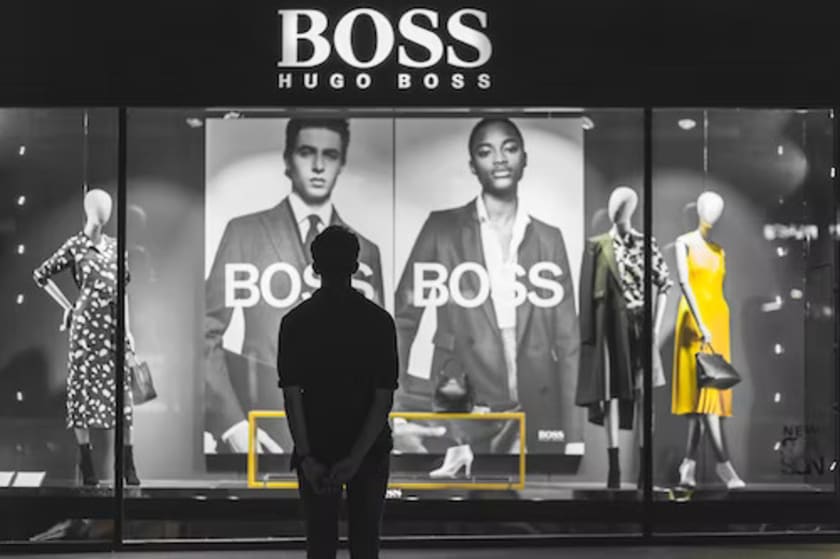
A trend is a style, design, or feature that is popular for a period of time. It also includes the way people are moving, living, and dressing. Trends are often noticed and imitated, and that is how fashion trends are born. Everyone wants to be in vogue, but with the advent of business analytics and data visualization, people can now see data in a visual format.
But data visualization is not new. We all remember the humble pie chart that would make our numerical analogies so much easier. What has changed, however, with the advent of mobile phone technology and big data is the uses that these visual representations of the information are being put to by the fashion industry. The industry is now taking complex business analytics and gathering emotional insight into numerical values with the help of data visualization.
Different types of data visualization
The most common paradigm of data visualization is the pie chart. But of course, there are other methods of data visualization that you can use.
- Charts: Charts such as donuts and pyramids are the most commonly used visualization tools for making big data easily understandable and impactful.
- Graphs: Graphs such as histograms and bars help make comparative analysis better for clearer context and communication across the channels in a fashion brand.

- Maps: Maps have gained traction after big data started gleaning information from customer mobile phones and web experiences. They help detect patterns, geographic clusters, and forecast trends for an apparel company.
- Animations: Animations represent interactive technology in business analytics and data visualization. They allow a personalized experience for a unique management style and a diverse decision-making process.
How data visualization is helping brands get on top of trends and challenges
Data visualization and business analytics have been helping businesses for a long time. The fashion industry has not been an exception to its benefits. The fashion and clothing industry is worth trillions of dollars annually, and the fashion industry is coming up with newer and more innovative ways of selling its products and services to customers. People want to wear things that suit their body types, but that's hard if you don't know what you are doing. Fashion data visualization allows people to find clothes that suit them more easily.
1. Customer-driven products
Whether it is business analytics or data visualization, the end goal is to find out what the customer wants. Data-driven maps are perfect for clothing and apparel brands that rely on trend forecasting and captive markets to increase customer footfalls and sales.
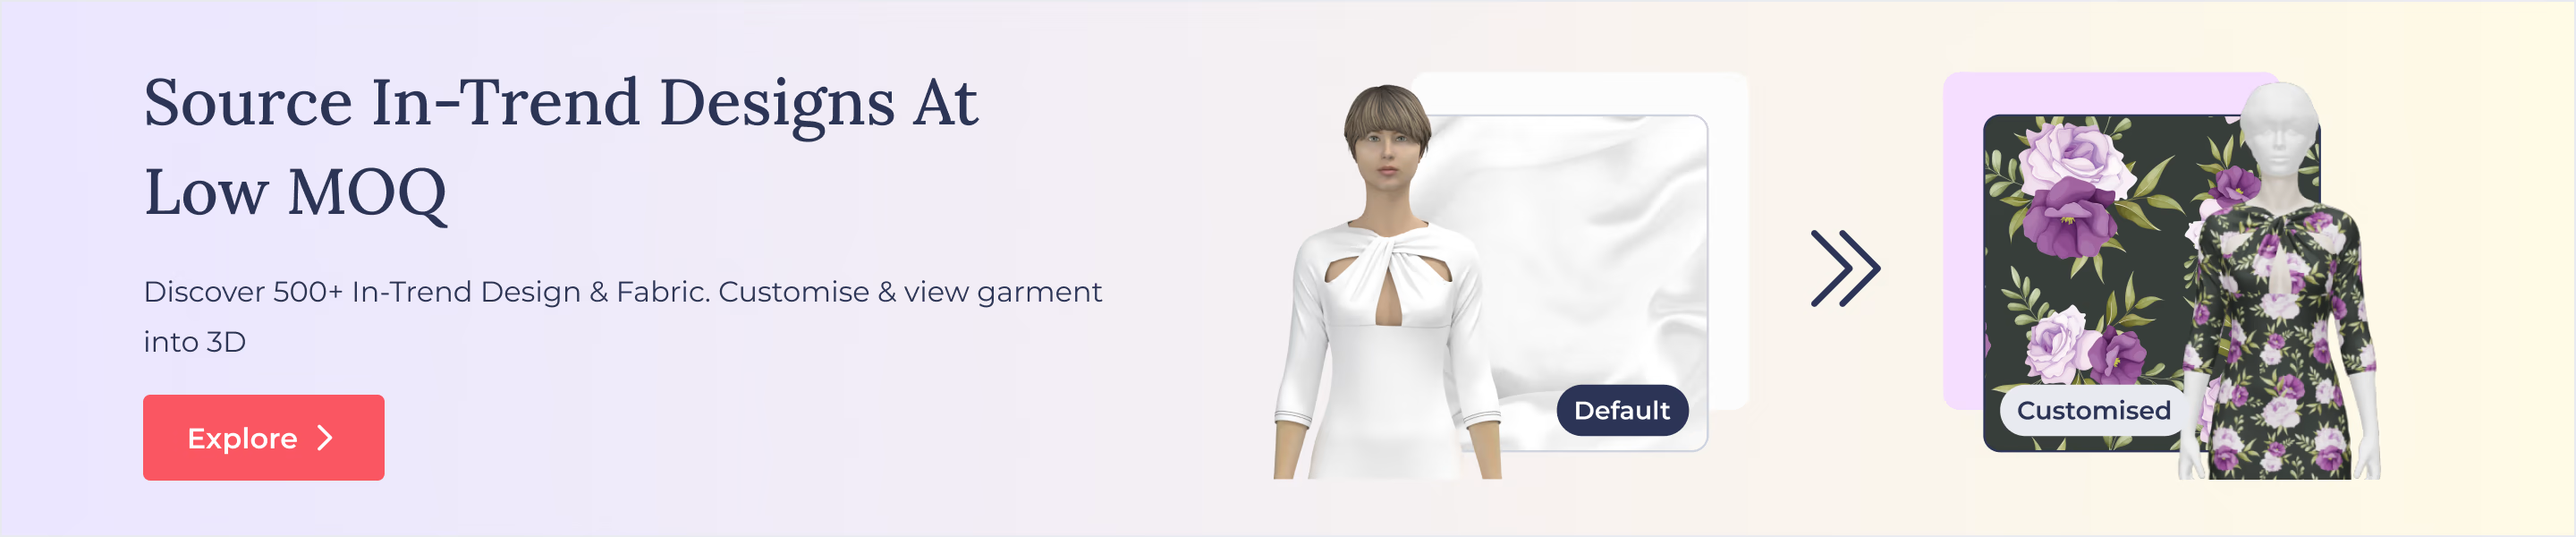
2. Personalized shopping experience
Data visualization charts and histograms, coupled with business analytics, can tailor a fashion brand’s production cycle to the demands of its target group. This is a highly personalized experience for hyper-connected customers who are short on patience and time to get what they want.
3. Targeted marketing strategy
Aggressive sales strategy is no longer about big sales budgets and visibility. It is more about lean-bit effect marketing ploys that have a far better conversion rate than conventional marketing campaigns in print, radio, and media. With data visualization tools such as pie charts, brands now know which customers to tap into, where to get them, and how to convert interest into sales.
4. Efficient supply chain management
Transforming big data into visuals makes business analytics precise and supply chains efficient. In fast fashion, well-defined and sustainable procurement helps a business become lean, saving on procurement, inventory, and shipping costs. Maps and animations also help in reliable last-mile deliveries and reduced Return to Origin.
5. Competitive pricing
One of the immediate perks of running a tight ship when it comes to supply chains is the competitive pricing of products. When the production and the marketing team understand what their goals are, with data visualization, their performance reflects higher profitability and sound bottom lines.
6. Efficient human resource planning
The best part about data visualization is that it takes advantage of the human brain’s programming to grasp visual representation quicker and more reliably. This allows a fashion brand to communicate its plans to all workers in clear and engaging terms. Visual data sets prevent overstaffing and reduce non-performing assets in an organization.
In a Nutshell
The fashion industry is ever-changing and growing. The rise and fall of fashion trends and preferences can be difficult to predict. There are various aspects involved in the industry, like advertising and sales, that are often considered before the designs are updated. Data visualization lends an emotional insight into the numerical values of business analytics. Data visualization has evolved from being a mere mathematical tool for businesses to a way of preserving, analyzing, and predicting customer behavior through historical values.
Fashinza can help you with predicting market shifts and trends with its tech-enabled data analytics and visualization. Whether it’s customer insights, buying patterns, or logistics backed by business analytics, you are just a call away from making your business grow in reach and size.
Key Takeaways
- Data visualization is the presentation of information in an easily understandable visual language such as charts, graphics, and animations.
- Data visualization is being increasingly used by fashion brands in modeling analysis and providing trends and buying insights along with the behavior and spending patterns of customers.
- This visual articulation of business analytics assists brands in creating what their customers really want.
Share this Story